WatchSat › Blog › How do satellites stay in orbit? Speed, drag and fuel
How do satellites stay in orbit? Speed, drag and fuel
How do satellites stay in orbit? They fall all the time but move sideways fast enough to keep missing Earth: about 7.7 km/s at the ISS's 420 km height.
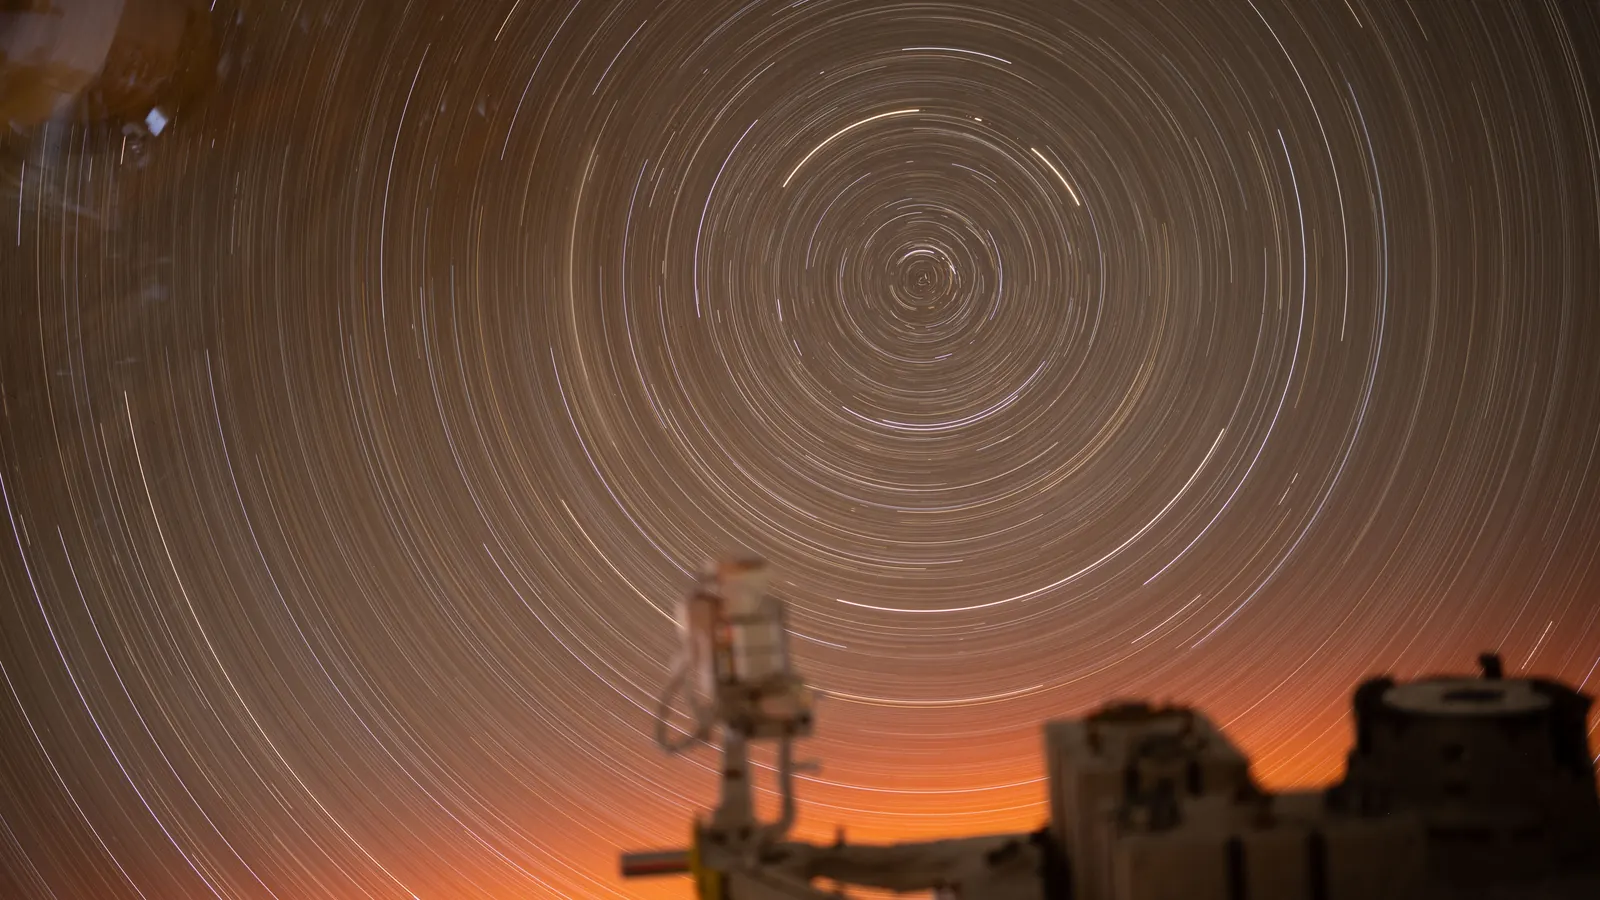
Satellites stay in orbit because they're falling toward Earth all the time while moving sideways so fast that the ground curves away beneath them as quickly as they drop. At the height of the International Space Station, about 420 km up, that takes roughly 7.7 km per second, or 17,100 mph. Gravity supplies the fall, and the launch rocket supplies the sideways speed. Satellites in low orbit also have to contend with the thin outer edge of the atmosphere, which drags them down unless they burn fuel to climb back.
Every moving dot on our live satellite map is falling this way. We used nine saved copies of CelesTrak's list of active satellites, the data behind that map, to measure how fast satellites travel at each height and how quickly the air pulls them down.
Why don't satellites fall to Earth?
Isaac Newton explained orbits with a thought experiment, a cannon firing sideways from an impossibly tall mountain, and NASA's Basics of Space Flight still uses it. Faster cannonballs land farther away, and one fast enough falls all the way around the planet, because the surface curves away as fast as it drops. NASA's student guide to orbits describes a satellite the same way, as always falling toward the planet but moving sideways fast enough never to hit it. Without gravity, the guide adds, it would fly off in a straight line.
A little arithmetic shows how exactly the fall and the curve cancel. Ignoring air, an object skimming Earth's surface falls 4.9 m in its first second. At 7.9 km/s it also covers 7.9 km, over which the curved surface drops away by the same 4.9 m, so its height doesn't change. Our post on the ISS's speed does the sum at the station's height.
Gravity hasn't gone away in orbit. NASA says it's about 90 percent as strong at the space station's height as on the ground, and astronauts float because they and the station are falling together.
The same pull keeps satellites from flying off into space. Fire the cannonball faster than circular speed, the exact speed for a circular orbit at its height, and it follows a stretched oval instead. At about 1.41 times circular speed it escapes Earth altogether. At 400 km up, by our calculation, circular speed is 7.67 km/s and escape speed is 10.85 km/s.
How fast do satellites travel?
The speed a satellite needs depends on its height, because gravity weakens with distance. NASA's orbit guide notes that the higher the orbit, the slower the satellite moves. Each lap is also longer, so the time per orbit grows much faster than the speed falls. Kepler's third law, which ties the time an orbit takes to its size, sets the exact relationship.
We used that law to turn each satellite's mean motion, the number of orbits it completes in a day, into an average height and speed. The October 11 copy of CelesTrak's active list holds 16,701 objects, and like CelesTrak's catalog we measure height above Earth's equatorial radius of 6,378 km.
| Satellites | Average height | Average speed | One orbit takes |
|---|---|---|---|
| International Space Station | 420 km | 7.66 km/s (17,129 mph) | 93.0 minutes |
| Starlink (median of 11,129) | 466 km | 7.63 km/s (17,072 mph) | 93.9 minutes |
| GPS (median) | 20,182 km | 3.87 km/s (8,666 mph) | 11 hours 58 minutes |
| Geostationary ring (median) | 35,786 km | 3.075 km/s (6,878 mph) | 23 hours 56 minutes |
The geostationary ring, where one orbit takes as long as one turn of the Earth, is 6.2 times farther from Earth's centre than the ISS. Satellites there move 2.49 times more slowly along a lap 264,925 km long, so one orbit takes 15.4 times as long. Our guide to the types of orbits explains what each band is used for.
Most of the list crowds into a narrow band of low orbit, so 79.2 percent of the 16,701 objects travel between 7.55 and 7.70 km/s. The fastest was STARLINK-4464, at 7.80 km/s in its orbit data for October 10, and it owed that speed to being only 168.5 km up and falling.
Drag, thrusters and fuel in our orbital data
Whether a satellite needs fuel to stay up depends mostly on its height. Low orbits sit in the faint top of the atmosphere. NOAA's Space Weather Prediction Center explains that solar activity heats and swells that air, which raises the drag, or air resistance, that satellites feel.
Each satellite is tracked with a two-line element set, a short block of orbit numbers. One of them, the drag term, is half the rate at which the satellite's mean motion is changing. A positive value means the satellite is completing more orbits each day as its orbit shrinks, and we converted it into metres of height lost per day. The term has limits. It's fitted to tracking data rather than measured directly, thruster burns can throw it off, and below about 1 m a day it's lost in the noise. In the October 11 copy, 83.8 percent of the 15,888 objects in low orbit had a positive drag term.
| Average height | Objects (October 11 copy) | Median sinking rate implied by the drag term, lowest and highest of nine copies |
|---|---|---|
| 300 to 400 km | 1,051 | 558 to 983 m a day |
| 400 to 500 km | 10,532 | 38.5 to 104.6 m a day |
| 500 to 600 km | 1,732 | 11.6 to 24.3 m a day |
| 600 to 800 km | 947 | 3.8 to 5.8 m a day |
| 800 to 1,000 km | 329 | 0.6 to 0.9 m a day |
| 1,000 to 2,000 km | 1,236 | 0.5 to 0.6 m a day |
The medians count only objects with a positive drag term. They shifted from copy to copy, which is why the table gives a range, and the October 11 copy gave the highest rates of the nine. The pattern held in every copy, though. Between about 300 and 700 km, each extra 135 km of height cut the rate about tenfold. The bottom two rows sit below the 1 m a day noise level.
To test the drag term, we matched the same objects in our first and last copies, a median 26.7 days apart, leaving out any that dropped off the list in between. Excluding Starlinks, the 832 objects that started between 400 and 500 km sank a median 46.8 m a day, close to the 46.5 their drag terms had predicted. Those that started at 300 to 400 km sank 307 m a day against 281 predicted. That group leaves out the fastest fallers, which dropped off the list, so it runs below the table's medians for the same band. Objects starting at 500 to 600 km sank 13.8 m a day against 16.8 predicted.
Starlinks in the 400 to 500 km band flew through the same air and hardly moved. Their drag terms implied about 49 m a day of sinking, yet the median change among 9,135 of them was 0.6 m a day downward. Of those, 92.8 percent changed height by less than 10 m a day on average, and 3,036 ended higher than they started. They hold their height with station-keeping, automatic engine burns that keep a satellite at its assigned altitude. William Parker and Richard Linares of MIT looked at the geomagnetic storm of May 2024, a major disturbance of Earth's magnetic field. They found that station-keeping, mostly by Starlinks, had nearly half the active satellites in low orbit maneuvering at once.
The space station gets fewer, bigger pushes. Apart from the boost, it sank an average 37.7 m a day across our copies. On September 25 the Cygnus XL cargo ship fired for 18 minutes, NASA said. Once the decay is allowed for, the station's average height rose about 1.87 km, roughly 50 days' worth of sinking. By our estimate the burn pushed the station forward by about 1.05 m/s. Yet it ended up 0.98 m/s slower, at 7,656.91 m/s instead of 7,657.89, because the push went into climbing and a higher orbit is a slower one.
Drag does the reverse. It drains energy from the orbit, the orbit shrinks, and the satellite speeds up. NASA's Swift observatory shows what happens to a satellite nobody can push back up. A commercial mission to boost it was called off on August 19, Via Satellite reported. Between its September 14 and October 10 element sets, Swift sank 29.3 km, to 299.3 km, while its average speed rose 16.9 m/s. By the end it was dropping 1.7 km a day. STARLINK-4464, the fastest object on the list, fell 114 km over the same weeks and gained 67 m/s. Our reentry explainer follows satellites like these down.
Fuel matters far above the air too. A geostationary satellite left uncorrected slowly tips out of the equator's plane, as our geostationary orbit explainer describes. Across 182 in our copies that were already tilted between 0.3 and 9 degrees, the tilt grew by a median 0.93 degrees a year.
How long a satellite stays up without thrust
NASA's Orbital Debris Program Office gives typical lifetimes for debris, which has no way to push itself back up. Debris below 600 km normally falls back to Earth within several years. At 800 km, orbital decay is often measured in centuries, and above 1,000 km debris normally keeps circling for a thousand years or more. The drag table above shows the sinking rate falling steeply with height, until in its top rows it drops below what our snapshots can measure. Our explainer on how long satellites last covers what else ends a satellite's working life.
Most of today's active satellites fly where falling back is quick. In the October 11 copy, 80.1 percent of the objects, every Starlink among them, have an average height below 600 km. Higher up, a dead satellite can last for generations. NASA's Basics of Space Flight points out that Vanguard 1, launched in 1958 and long silent, is still falling around Earth.
The ISS sits in the quick-falling zone and will need another push before long. Between its October 7 and October 10 element sets it sank 48 m a day, its fastest rate since the boost. The next reboost will show up as a jump in its average height, in the same orbital elements that drive the ISS's live position.
Sources
- NASA, What Is an Orbit? (Grades 5-8) and What Is Microgravity? (Grades 5-8), undated
- NASA Science, Basics of Space Flight, Chapter 3: Gravity and Mechanics, undated
- NASA Orbital Debris Program Office, Frequently Asked Questions, undated, retrieved October 11, 2026
- NOAA Space Weather Prediction Center, Satellite Drag, accessed October 11, 2026
- NASA Space Station blog, NASA, Northrop Grumman Complete Cygnus XL Space Station Reboost, September 25, 2026
- William Parker and Richard Linares, Satellite Drag Analysis During the May 2024 Gannon Geomagnetic Storm, arXiv, June 12, 2024
- Via Satellite, Katalyst LINK mission is unable to rescue NASA Swift observatory, August 19, 2026
- CelesTrak, active satellites element sets, nine WatchSat copies from September 15 to October 11, 2026
Follow by RSS. Share this post: Bluesky · X · Reddit · Email
More from the blog
-
Where is New Horizons now? Distance, speed and what's next
New Horizons was 65.77 AU from the Sun on October 8, 2026, and its signals took 9 hours 6 minutes to reach Earth. It's still inside the heliosphere.
-
Can satellites connect directly to your phone? How it works
Satellites can connect directly to your phone for texts. Starlink says it has launched 650 direct-to-cell satellites. How it works and who offers it.
-
How does Starlink work? Orbits, dishes and laser links
Starlink links a phased-array dish to more than 11,000 satellites, most in shells about 460 to 485 km up, which relay traffic by laser and through gateways.
-
How long do satellites last? Lifespan by orbit and type
How long do satellites last? Most active ones are Starlinks, built for five years. New GPS satellites get 15, and Landsat 5, built for three, lasted 28 years.
-
When will the ISS be retired? Deorbit plan and what's next
NASA plans to retire the ISS after September 30, 2030, when operations end. A SpaceX-built vehicle then steers it into the South Pacific in about 2031.
Home · Live satellite map · Satellite directory · Starlink · OneWeb · Navigation satellites · Space stations · Other active satellites · Track the ISS · ISS visible passes · Starlink train · Rocket launches · Aurora forecast · Humans in space · Solar System · Deep Space · Embed widgets · Blog · Guide: spot the ISS · Guide: what is a TLE? · Guide: how many satellites? · Guide: satellite trackers compared · Discovery: Elias 2-24 b · About · FAQ · Data & methodology · Credits · Editorial policy · Accessibility · Contact · Privacy · Terms
© 2026 WatchSat · Not affiliated with any space agency or satellite operator.