WatchSat › Blog › How do solar storms affect satellites? Drag, GPS, Starlink
How do solar storms affect satellites? Drag, GPS, Starlink
Solar storms affect satellites by heating the upper air, which adds drag in low orbit, and by skewing GPS. A mild 2022 storm downed 38 of 49 new Starlinks.
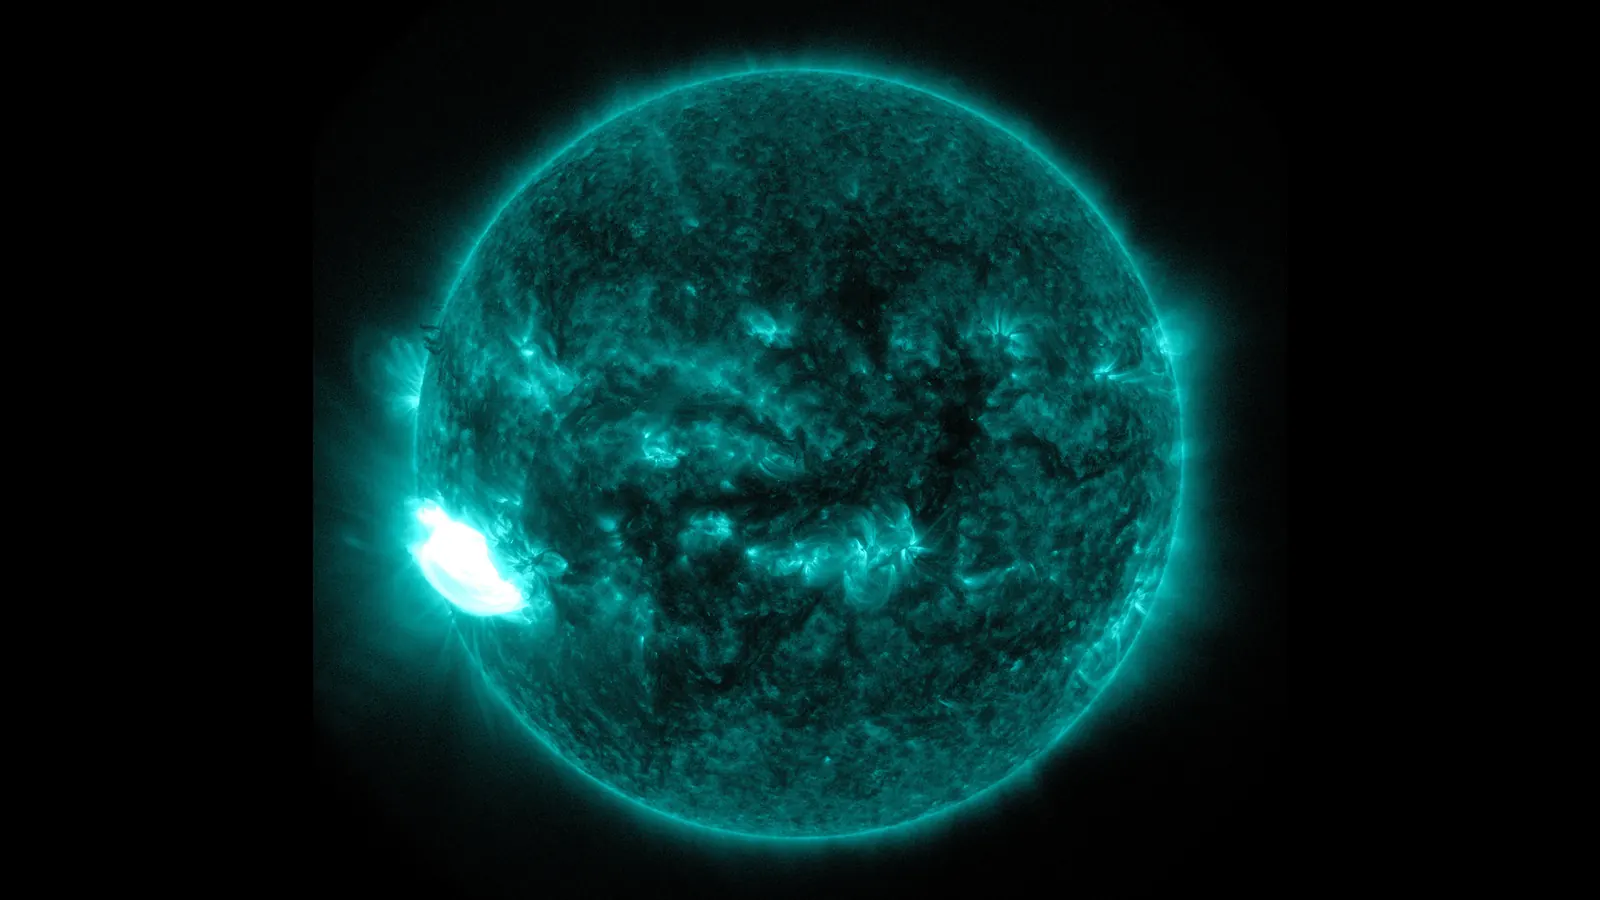
Solar storms affect satellites mostly through the thin air and the charged gas around them. A geomagnetic storm heats Earth's upper atmosphere so that it drags harder on spacecraft in low orbit. In February 2022 that extra drag brought down 38 of 49 Starlink satellites SpaceX had just launched. Beyond drag, the effects depend on altitude and the kind of storm. Energetic protons can upset electronics and wear down solar panels, and a disturbed ionosphere throws off GPS positions.
A solar storm starts with an eruption on the Sun, either a flare or a coronal mass ejection, which is a cloud of magnetized gas thrown out into space. NOAA's Space Weather Prediction Center rates what reaches Earth on three scales, G for geomagnetic storms, S for solar radiation storms and R for radio blackouts. The G scale follows the planetary K-index, or Kp, which measures how disturbed Earth's magnetic field is and also drives WatchSat's aurora forecast. G1 (minor) begins at Kp 5, G2 at Kp 6, G3 at Kp 7, G4 at Kp 8 and G5 (extreme) at Kp 9.
Storms cluster around solar maximum. NASA and NOAA announced on October 15, 2024 that Solar Cycle 25 had reached its maximum period. The smoothed sunspot number, a running average used to track the cycle, peaked at 160.9 that month. By September 2026 the monthly count was down to 60.3, but the agencies noted that fairly significant storms often come in the declining phase.
Why does a geomagnetic storm increase satellite drag?
Satellite drag is the push of thin upper air against a moving spacecraft, which saps orbital energy so the satellite sinks lower. During a geomagnetic storm, NOAA explains, the interaction between the solar wind and Earth's magnetic field can bring "large short-term increases in upper atmosphere temperature and density." The heated atmosphere swells, and a satellite at a fixed height meets denser air.
NOAA's alert for the G2 storm of October 4, 2026 read: "Satellite orientation irregularities may occur; increased drag on low Earth-orbit satellites is possible." At G5, the top of the scale, NOAA warns of extensive surface charging, where static builds up on a spacecraft's outer skin, along with problems with orientation and tracking. Storms at the bottom of the scale are common. NOAA counts about 1,700 G1 and 600 G2 storms in an average 11-year cycle, against four G5s.
Spaceweather.com publishes a Starlink drag index, its estimate of how fast a typical Starlink at 480 km (298 miles) is sinking. On October 10, before that day's storm peaked, it read 45.1 m (148 ft) a day. So far in 2026 its readings have run from 19.7 m a day on August 10 to 127.6 m on January 20.
The strongest recent test came on May 10–12, 2024, when NOAA observed G5 conditions from 6:54 p.m. EDT on May 10. MIT's William Parker and Richard Linares call it the largest geomagnetic storm in over 20 years. They worked out how much denser the air became from how fast orbits decayed. For that they used the two-line element sets for every tracked object in low orbit, the same public orbit data WatchSat uses. Automated station-keeping, the small engine burns that hold a satellite at its assigned height, set nearly half the active satellites in low orbit maneuvering at once, most of them Starlinks. That made it very difficult to screen for possible collisions for days. NASA's ICESat-2 went into safe mode, likely because of the added drag.
What happened to Starlink in February 2022
On February 3, 2022, SpaceX launched 49 Starlinks and released them into an orbit with a perigee, or low point, of about 210 km (130 miles). A NOAA-led paper in the journal Space Weather found they were deployed during one geomagnetic storm, with a second the next day. Another Space Weather paper, by Dang and colleagues, estimates that air density near that height rose around 20 to 30 percent on February 4, and may have topped 60 percent in places. According to NASA's Scientific Visualization Studio, 38 of the 49 reentered within a few days.
The storms themselves were ordinary. The NOAA-led paper calls them moderate, and CIRES at the University of Colorado calls the main one minor. NOAA and CIRES researchers, working with Starlink engineers, backed SpaceX's early finding that high drag and reduced stability brought the satellites down.
Can a geomagnetic storm knock out GPS?
A storm can degrade GPS badly even though it doesn't touch the satellites. In our latest snapshot the GPS satellites orbit at an average of 20,221 km (12,565 miles), about 48 times as high as the International Space Station and well clear of drag. The trouble is in the ionosphere, the charged layer the signals cross.
NOAA explains that a geomagnetic storm raises the ionosphere's total electron content, the number of free electrons along a signal's path, in ways GPS receivers can't model. That puts errors into position fixes. That happens mostly at high latitudes, though major storms reach the mid-latitudes. Near the magnetic equator, the ionosphere also forms bubbles that make signals flicker, or scintillate, worst just after sunset. Dual-frequency receivers there often lose lock on the signal.
Precision farming felt this in May 2024. NASA reports that some GPS-guided tractor models veered off course or stopped working during planting, and quotes a Kansas State University economist's estimate that affected farms lost about $17,000 each.
Radiation storms are a separate hazard. NOAA's S scale is set by protons with energies of 10 MeV (million electron volts) and up, measured by GOES satellites such as GOES-19. At S3 it lists single-event upsets, bit flips caused by one energetic particle, along with noise in imaging systems and a slight loss of solar-panel efficiency. At S5 it warns of permanent damage to solar panels. Flares cause a third kind of trouble, radio blackouts on the R scale. A flare rated M6.4 by its X-ray brightness set off an R2 event on October 10, 2026, which NOAA said meant a "limited blackout of HF (high frequency) radio communication for tens of minutes."
What WatchSat's element sets show
WatchSat keeps CelesTrak's active-satellite list for its live satellite map, and the copies we've saved since mid-September let us run a small version of Parker and Linares's test on the October 4 G2 storm. For each Starlink that appears in two consecutive copies, we worked out its average height from each element set, measured above Earth's equatorial radius of 6,378 km as in CelesTrak's catalog. Dividing the change in height by the time between the two element sets gives a rate in meters per day. We kept the 450 to 560 km band, where 9,705 of the 11,132 Starlinks fly, and dropped the few that were plainly raising or lowering their orbits on purpose. About 9,000 satellites remained in each of six windows.
| Element-set dates, 2026 | Length | NOAA storm alerts | Mean altitude change |
|---|---|---|---|
| Sep 14 to Sep 16 | 2.3 days | none | −5.2 m/day |
| Sep 16 to Sep 23 | 7.5 days | none | −0.9 m/day |
| Sep 23 to Sep 27 | 3.1 days | none | +2.4 m/day |
| Sep 27 to Sep 30 | 3.7 days | none | −4.4 m/day |
| Sep 30 to Oct 5 | 4.4 days | G2 on Oct 4 | −7.2 m/day |
| Oct 5 to Oct 7 | 2.5 days | G1 on Oct 5 | +6.1 m/day |
The storm window has the steepest average fall, 7.2 m a day, and the window after it has the biggest gain. The quiet windows swing nearly as far. Taken together, the other five windows average −0.4 m a day, and their standard deviation, which measures the typical spread, is 4.7 m a day. The storm window sits 1.4 standard deviations below that average (z = −1.4), well short of a clear signal. With about 9,000 satellites in each window, chance alone moves a window's average by only 0.2 to 0.3 m a day. The swings between windows are far bigger than that, and they probably reflect timing, such as when element sets were refreshed or thrusters fired.
Thrusters are the likeliest reason the storm barely shows. Each element set also carries a drag term, which records how fast the orbit was decaying when the set was fitted. For the Starlinks between 475 and 490 km whose drag term shows a decaying orbit, it implies median sinks of 32 to 80 m a day across our snapshots, the same range as Spaceweather.com's 45.1. Yet their net change from one snapshot to the next stays within about 8 m a day either way. We read the gap as thruster work, with a storm showing up mostly as extra burns, which fits what Parker and Linares saw in 2024. Our windows are also coarse. Suppose, for illustration, that a G2 storm doubled air density for 12 hours. A Starlink sinking 45.1 m a day would then drop only about 23 m extra, roughly 5 m a day when spread over a 4.4-day window.
Most of what we track flies low. Of the 16,683 objects in our latest snapshot, 13,365, or 80.1 percent, have a mean altitude below 600 km. Among them are 940 Starlinks below 400 km. Some are new and still climbing to their working altitude, and others are old ones on their way down, as our reentry explainer shows. The air is denser that low, so these are the Starlinks most exposed to storm drag. One is the Starship-launched Starlink-40083, near 316 km.
The G3 storm of October 10 isn't in any of these windows yet. The element sets in our latest snapshot run up to 02:09 UTC that day, about 16 hours before NOAA's alert at 17:58 UTC that the K-index had reached 7. Our post on the October 10 G3 storm covers what NOAA measured.
WatchSat's catalog refresh is scheduled for 05:43 UTC on Mondays and Thursdays. The copies due October 12 and October 15 should be the first to cover the storm, and we'll rerun the comparison then. G3 is only one step above G2, Kp 7 against Kp 6. We expect the storm window to come out a few meters a day lower than quiet ones, possibly still inside the noise, because the Starlink constellation keeps thrusting through storms.
Sources
- NOAA Space Weather Prediction Center: NOAA Space Weather Scales, read October 10, 2026; Satellite Drag and Space Weather and GPS Systems, accessed October 11, 2026; alerts, watches and warnings feed, read October 10, 2026; observed solar cycle indices, read October 10, 2026; G5 Conditions Observed!, May 10, 2024
- NASA Science, NASA, NOAA: Sun Reaches Maximum Phase in 11-Year Solar Cycle, October 15, 2024
- NASA Science, What NASA Is Learning from the Biggest Geomagnetic Storm in 20 Years, 2025
- William Parker and Richard Linares, Satellite Drag Analysis During the May 2024 Gannon Geomagnetic Storm, arXiv, June 12, 2024 (revised July 15, 2024)
- Fang and colleagues, Space Weather Environment During the SpaceX Starlink Satellite Loss in February 2022, Space Weather, 2022
- Dang and colleagues, Unveiling the Space Weather During the Starlink Satellites Destruction Event on 4 February 2022, Space Weather, 2022
- CIRES, Minor geomagnetic storm, big impact: the February 2022 Starlink satellite loss, 2022
- NASA Scientific Visualization Studio, Geomagnetic Storm Causes Starlink Satellite Loss, accessed October 11, 2026
- Spaceweather.com, Starlink drag index, October 10, 2026
- CelesTrak, active satellites element sets, as saved by WatchSat with element sets up to October 10, 2026
Follow by RSS. Share this post: Bluesky · X · Reddit · Email
More from the blog
-
What happens when a satellite reenters the atmosphere?
When a satellite reenters the atmosphere it breaks apart about 78 km up and mostly melts away, though tanks can survive. About two Starlinks fall each day.
-
Do satellites affect astronomy? Streaks, Starlink and Rubin
Do satellites affect astronomy? Streaks crossed 2.7% of Hubble exposures from 2002 to 2021, and Rubin simulates trails in about 10% of its survey images.
-
How much space debris is in orbit? 2026 counts and risks
How much space debris is in orbit? The US catalog lists about 34,000 objects, ESA counts about 47,000 tracked, and models estimate 1.5 million of 1 to 10 cm.
-
What is a sun-synchronous orbit? Polar orbits and dawn-dusk
A sun-synchronous orbit turns 0.9856° a day with the Sun, so Landsat 9 crosses the equator southbound near 10:12 a.m. One in five active satellites flies one.
-
Where is the Hubble Space Telescope now? Orbit and reentry
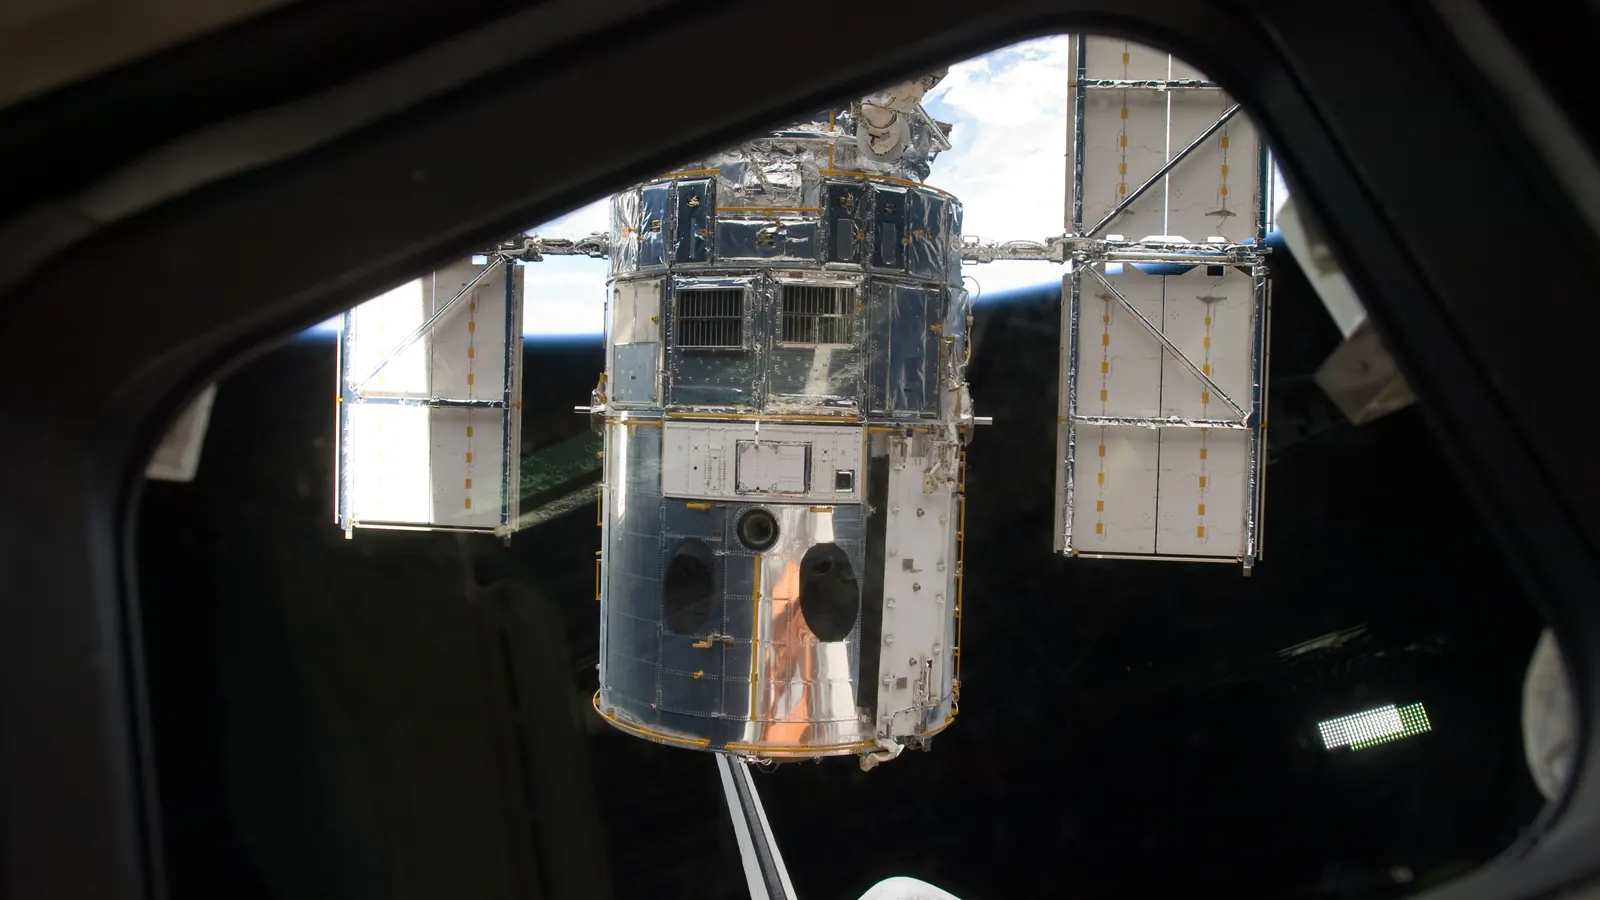
The Hubble Space Telescope orbits about 470 km up and is sinking roughly 10 km a year. STScI puts its most likely reentry in 2033 unless it gets a boost.
Home · Live satellite map · Satellite directory · Starlink · OneWeb · Navigation satellites · Space stations · Other active satellites · Track the ISS · ISS visible passes · Starlink train · Rocket launches · Aurora forecast · Humans in space · Solar System · Deep Space · Embed widgets · Blog · Guide: spot the ISS · Guide: what is a TLE? · Guide: how many satellites? · Guide: satellite trackers compared · Discovery: Elias 2-24 b · About · FAQ · Data & methodology · Credits · Editorial policy · Accessibility · Contact · Privacy · Terms
© 2026 WatchSat · Not affiliated with any space agency or satellite operator.