WatchSat › Blog › Do satellites affect astronomy? Streaks, Starlink and Rubin
Do satellites affect astronomy? Streaks, Starlink and Rubin
Do satellites affect astronomy? Streaks crossed 2.7% of Hubble exposures from 2002 to 2021, and Rubin simulates trails in about 10% of its survey images.
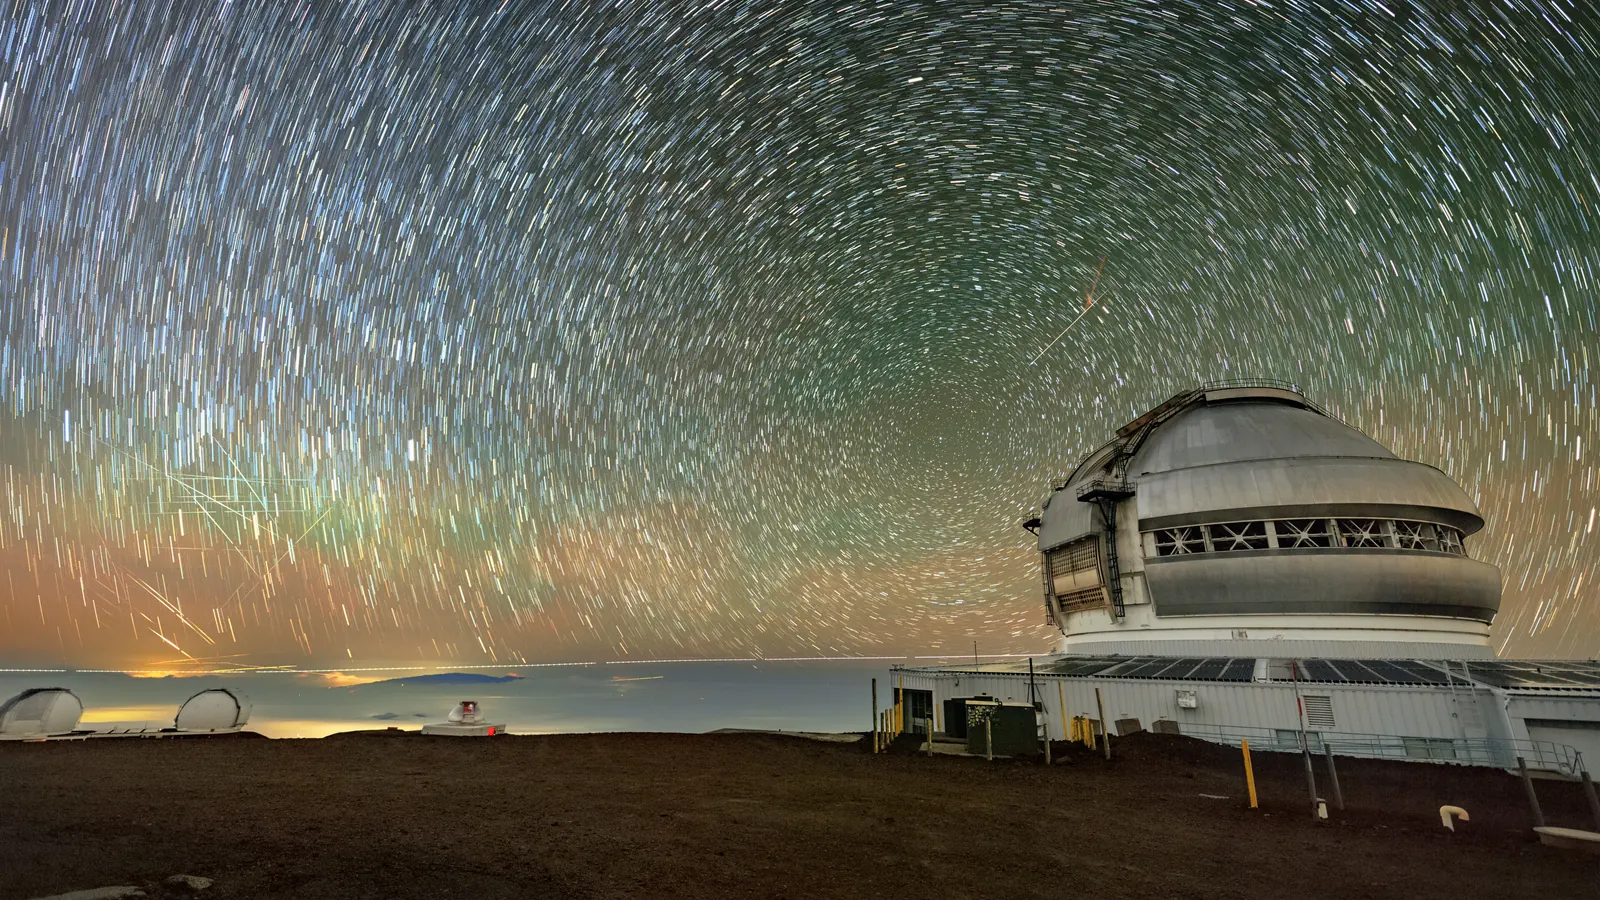
Satellites do affect astronomy, and Hubble's archive shows by how much. Of the Hubble Space Telescope's individual exposures from 2002 to 2021, 2.7% had a satellite trail across them. For the Vera C. Rubin Observatory, simulations of a sky with 40,000 low-orbit satellites put at least one trail in about 10% of its survey images and in most of those taken in twilight. Streaks in images are the problem most people have seen, and radio telescopes pick up satellites too.
Most of the satellites now in service are Starlinks. In our October 8 snapshot of CelesTrak's active list, 11,132 of 16,683 working satellites, two-thirds of the total, belonged to SpaceX's Starlink constellation. Six large constellations together made up 75.9%.
How do satellite streaks get into telescope images?
A satellite has no light of its own and shines only by reflecting sunlight. It shows up while it's still in sunshine and the ground below is dark, in the hours after sunset and before sunrise. Satellites also move fast. By our calculation, a satellite 480 km up crosses 3.5 degrees of sky overhead, the width of Rubin's field of view, in 3.8 seconds. One that enters the field during an exposure draws a line from edge to edge.
Hubble catches them too, from orbit. Kruk and colleagues searched the Hubble archive with citizen-science volunteers and a deep-learning algorithm. Their 2023 paper in Nature Astronomy and its released dataset count satellites in 3,072 of 114,607 images, with 3,228 trails in all. A typical trail covers less than 0.5% of a single exposure, according to the Space Telescope Science Institute (STScI).
Hubble also flies through Starlink's busiest band. In our snapshot, Hubble's orbit averages 470 km up, measured above Earth's equatorial radius of 6,378 km. Within 10 km of that height fly 5,914 Starlinks, 53.1% of the constellation, though in orbits with a different tilt. Kruk's sample ends in 2021, so it can't show whether that matters.
On the ground, at Palomar's Zwicky Transient Facility, Caltech reported that the share of twilight images with Starlink streaks rose from 0.5% in late 2019 to about 18% in August 2021.
Rubin Observatory and satellite trails
Rubin, on Cerro Pachón in Chile, released its First Look images on June 23, 2025, and began its ten-year Legacy Survey of Space and Time (LSST) on the night of June 29, 2026. The survey uses six filters, and Rubin calls each 30-second look at a patch of sky a visit. Its FAQ says a low-orbit satellite moves about 15 degrees during one visit, leaving a streak across the whole 3.5-degree field.
The 10% figure comes from simulations of the LSST schedule against 40,000 low-orbit satellites. The 2022 study behind it, by Hu and colleagues, modelled 40,768 Starlink and OneWeb satellites and found that giving up 10% of observing time to dodge them would halve the share of visits with streaks.
Rubin's processing pipeline flags the pixels in each streak it detects and leaves them out of its deep stacked images, though a data-management note says some streaks slip through. Brightness decides how much is lost. Astronomers measure it in magnitudes, where larger numbers mean fainter objects. Satellites fainter than about 6th to 7th magnitude typically leave the rest of an image usable, Rubin says, while brighter ones can affect a whole detector in its camera. The data under a masked streak are gone either way, as the IAU's Centre for the Protection of the Dark and Quiet Sky from Satellite Constellation Interference (CPS) points out.
How bright are Starlink satellites?
Each step on the magnitude scale is a factor of 2.512 in brightness. The CPS, launched in April 2022 and co-hosted by NOIRLab and the SKA Observatory, recommends that satellites be no brighter than magnitude 7, a limit meant to protect research. Sky & Telescope describes it as applying up to 550 km, with a gradually fainter limit above that, and gives magnitude 6 as the level at which satellites distract from a dark-sky view.
A 2023 review by Anthony Mallama and colleagues found that the sunshade on SpaceX's VisorSat model cut its brightness by a factor of three. In June 2023 the same group measured second-generation Starlink Minis in brightness-mitigation mode at a mean apparent magnitude of 7.06. After correcting for distance, that made them 12 times fainter than unmitigated ones. In a 2024 paper, Minis still climbing after launch averaged magnitude 2.68 below 357 km and 6.46 above it, a difference of about 30 times in brightness. Our Starlink train page shows when such fresh batches pass over you.
In a wider survey, Jack Rayworth and nine co-authors recorded about 25,000 tracks of 5,118 satellites from a mid-northern site in late 2024. They found Starlinks brighter than the CPS limit on roughly a quarter of the passes the geometry allowed, Guowang satellites on more than half and OneWeb on about one in twenty. Their preprint, posted on October 7, 2026 and not yet peer reviewed, predicts that about one in three 30-second twilight exposures at Rubin will show a trail.
AST SpaceMobile's BlueBirds are far brighter than working Starlinks. Mallama and Richard Cole measured the Block 1 BlueBirds at a mean magnitude of 3.30, about 30 times brighter than the magnitude-7 line. The first Block 2 satellite, BlueBird 6, came in fainter, at 3.85, even though it's about 3.5 times larger. They write that all BlueBirds exceed the IAU limits.
Radio astronomers have a separate problem. Di Vruno and colleagues used the LOFAR radio telescope to observe 68 Starlinks. From dozens of them they detected emission between 110 and 188 MHz, far from the 10.7 to 12.7 GHz downlinks the satellites use to send data to the ground. The levels were above the thresholds the International Telecommunication Union (ITU) sets to protect radio astronomy. Their paper came out in August 2023. A 2024 follow-up led by Bassa found second-generation satellites leaking up to 32 times more strongly than first-generation ones.
Starlink heights and a simulated night at Cerro Pachón
We counted the large constellations in our October 8 snapshot by the names CelesTrak gives them, as in our September count of active satellites, with each group's median height.
| Constellation | Catalog name | Satellites | Median height |
|---|---|---|---|
| Starlink | STARLINK | 11,132 | 466 km |
| OneWeb | ONEWEB | 651 | 1,202 km |
| Kuiper (Amazon) | KUIPER | 391 | 630 km |
| Qianfan | QIANFAN | 257 | 1,068 km |
| Guowang | HULIANWANG DIGUI | 213 | 1,149 km |
| AST SpaceMobile | SPACEMOBILE | 12 | 517 km |
All 12 AST satellites orbit between 505 and 528 km, inside the range Sky & Telescope gives for the magnitude-7 limit. OneWeb has its own constellation page, and the other four sit among the other satellites in our directory.
Half of all Starlinks orbit below about 466 km, and 85.5% sit between 450 and 500 km. The smaller group at 540 km or higher shrank from 514 in our September 15 snapshot to 357 on October 8, down 31% in a little over three weeks. None of those satellites left the list. The 157 that dropped out of the group were lowered below 540 km, and CelesTrak's data don't say why.
Height cuts both ways for astronomers. Counting distance alone, a satellite overhead at 480 km is 0.30 magnitude brighter than the same one at 550 km, and at OneWeb's 1,200 km it's 1.69 magnitudes fainter than at 550. Lower satellites also slip into Earth's shadow sooner. Overhead, one at 480 km stays sunlit until the Sun is 21.6 degrees below the horizon, one at 550 km until 23.0 degrees and one at 1,200 km until 32.7. At Cerro Pachón on October 11, those points come 101, 108 and 159 minutes after sunset.
To see how the timing plays out, we simulated one night for a Rubin-sized field. We ran it every five minutes from sunset on October 11 to sunrise on October 12. At each step we moved every satellite in the six constellations along its orbit with SGP4, the standard model for predicting positions from orbital elements (explained in our guide to TLEs). We then pointed 3,000 imaginary 3.5-degree fields at random spots more than 30 degrees above Cerro Pachón's horizon. We followed the sunlit satellites through a 30-second exposure and counted how many of those fields at least one of them crossed.
Until the Sun was 18 degrees below the horizon, the point where astronomical twilight ends, about one exposure in five (21.9%) was crossed by a sunlit Starlink. With the Sun 18 to 24 degrees down that fell to 12.6%, and with the Sun lower still it fell to 0.2%. Across all the steps after nautical twilight ended, with the Sun more than 12 degrees down, 3.8% of exposures were crossed by a Starlink and 5.2% by any of the six constellations. For 6.8 of the 11.3 hours between sunset and sunrise, no sunlit Starlink was more than 30 degrees up.
These are geometry numbers only. The simulation counts every sunlit satellite as a streak however faint, and it doesn't use Rubin's scheduler. It covers one October night, with approximate site coordinates. Scaled in proportion to fleet size, up to the 40,768 satellites in Hu's study, the 5.2% becomes about 17%, the same order of magnitude as Rubin's 10%.
We haven't found streak counts from Rubin's own survey images yet. Those are the next numbers to watch for, along with whether Starlink's 540-km tail keeps shrinking in our coming snapshots.
Sources
- Kruk, S., et al., The impact of satellite trails on Hubble Space Telescope observations, Nature Astronomy, 2023; the authors' classification dataset, Zenodo, December 2022
- STScI, Example of satellite trail in Hubble Space Telescope exposure, 2023
- Caltech, Palomar survey instrument analyzes impact of Starlink satellites, 2022
- Rubin Observatory, Impacts from artificial satellites and debris (FAQ), accessed October 11, 2026; technical note DMTN-197
- NOIRLab, Ever-changing Universe Revealed in First Imagery From NSF-DOE Vera C. Rubin Observatory, June 23, 2025
- Fermilab, LSST start announcement, June 2026; Astronomy, Vera C. Rubin Observatory begins its Legacy Survey of Space and Time, June 30, 2026
- Hu, J. A., Rawls, M., Yoachim, P., Ivezić, Ž., Satellite Constellation Avoidance with the Rubin Observatory Legacy Survey of Space and Time, ApJ Letters, 2022
- IAU CPS, About CPS and home page; NOIRLab, Media advisory: IAU Centre for the Protection of the Dark and Quiet Sky from Satellite Constellation Interference, February 2022
- Sky & Telescope, Satellite constellations are too bright for astronomy, 2025
- Mallama, A., et al., Starlink Generation 2 Mini Satellites: Photometric Characterization, arXiv, June 11, 2023; Assessment of Brightness Mitigation Practices for Starlink Satellites, arXiv, September 2023; The Brightness of Starlink Mini Satellites During Orbit-Raising, arXiv, May 2024
- Mallama, A., Cole, R. E., BlueBird 6 is Fainter than Block 1 Satellites, arXiv, August 24, 2026
- Rayworth, J., et al., Systematic non-compliance of satellite megaconstellations with IAU brightness limits, arXiv preprint, October 7, 2026
- Di Vruno et al., Unintended electromagnetic radiation from Starlink satellites detected with LOFAR between 110 and 188 MHz, Astronomy & Astrophysics 676, A75, August 10, 2023
- Bassa, C. G., et al., Bright unintended electromagnetic radiation from second-generation Starlink satellites, Astronomy & Astrophysics 689, L10, September 2024
- CelesTrak, Current GP element sets (the active list in WatchSat's snapshots of September 15 and October 8, 2026)
Follow by RSS. Share this post: Bluesky · X · Reddit · Email
More from the blog
-
How fast does the ISS travel? Speed, altitude and orbit
How fast does the ISS travel? About 17,100 mph (7.66 km/s), circling Earth every 93 minutes 420 km up. Why it sinks, and how it gets pushed back up.
-
What happens when a satellite reenters the atmosphere?
When a satellite reenters the atmosphere it breaks apart about 78 km up and mostly melts away, though tanks can survive. About two Starlinks fall each day.
-
How do solar storms affect satellites? Drag, GPS, Starlink
Solar storms affect satellites by heating the upper air, which adds drag in low orbit, and by skewing GPS. A mild 2022 storm downed 38 of 49 new Starlinks.
-
How much space debris is in orbit? 2026 counts and risks
How much space debris is in orbit? The US catalog lists about 34,000 objects, ESA counts about 47,000 tracked, and models estimate 1.5 million of 1 to 10 cm.
-
What is a sun-synchronous orbit? Polar orbits and dawn-dusk
A sun-synchronous orbit turns 0.9856° a day with the Sun, so Landsat 9 crosses the equator southbound near 10:12 a.m. One in five active satellites flies one.
Home · Live satellite map · Satellite directory · Starlink · OneWeb · Navigation satellites · Space stations · Other active satellites · Track the ISS · ISS visible passes · Starlink train · Rocket launches · Aurora forecast · Humans in space · Solar System · Deep Space · Embed widgets · Blog · Guide: spot the ISS · Guide: what is a TLE? · Guide: how many satellites? · Guide: satellite trackers compared · Discovery: Elias 2-24 b · About · FAQ · Data & methodology · Credits · Editorial policy · Accessibility · Contact · Privacy · Terms
© 2026 WatchSat · Not affiliated with any space agency or satellite operator.