WatchSat › Blog › What are the Van Allen belts? Altitude, risks and satellites
What are the Van Allen belts? Altitude, risks and satellites
The Van Allen belts are two zones of trapped particles, about 1,600 to 40,200 km up by NASA figures. Of 16,701 active satellites, 95% stay below 2,000 km.
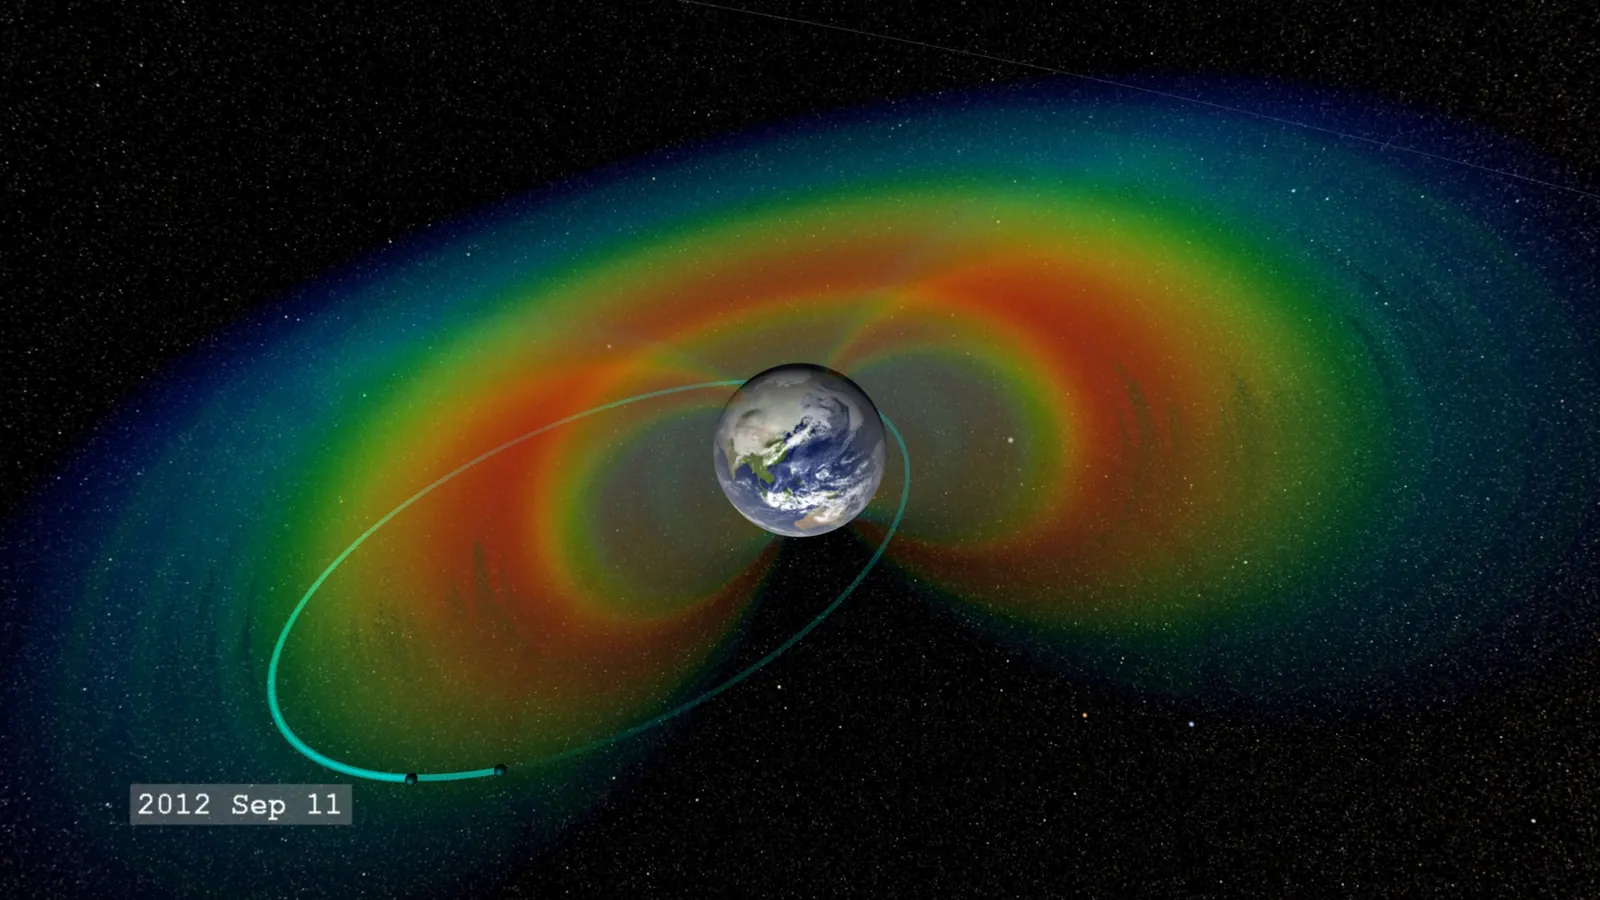
The Van Allen belts are two doughnut-shaped zones of charged particles trapped by Earth's magnetic field, an inner belt made mostly of protons and an outer belt mostly of electrons. NASA's Scientific Visualization Studio (SVS) puts the inner belt about 1,000 to 8,000 miles (1,600 to 12,900 km) above the equator. The outer belt, by the same figures, sits about 12,000 to 25,000 miles (19,300 to 40,200 km) up, and the gap between them is called the slot. The edges shift with the particles' energy and the Sun's activity, so sources differ on the exact heights.
Most satellites stay at or near the belts' lower edge. Of the 16,701 on CelesTrak's active list in our October 11 snapshot, 95% never climb above 2,000 km, including the International Space Station at about 420 km.
The belts are named after James Van Allen, whose Iowa team found them. The team's Geiger counter on Explorer 1, launched January 31, 1958, went quiet above about 1,100 km. Explorer 3 followed on March 26 with a tape recorder added, and its record showed the counter falling silent because intense radiation was swamping it. NASA credits the group with finding the inner belt this way. The outer belt showed up later, in data from Explorer IV and Pioneer 3.
How far above Earth are the Van Allen belts?
It depends on whose figures you use. A radiation-effects chapter by Barnes and Selva of NASA's Jet Propulsion Laboratory places the belts between roughly 1,000 and 32,000 km, with electron intensity peaking near 4,000 and 24,000 km. A NASA release on the slot puts that gap at about 7,000 to 13,000 km (4,350 to 8,110 miles) up, which overlaps the top of the inner belt as the SVS draws it.
The inner belt is relatively stable, while the outer one varies far more in energy and intensity and changes much faster. NASA's twin Van Allen Probes found that low-energy electrons, around 0.1 MeV (million electron volts, a measure of a particle's energy), make the inner belt much larger than in the traditional picture. They also saw electrons of up to about 0.8 MeV fill the slot during almost all geomagnetic storms, the major disturbances of Earth's magnetic field.
Only the two main belts are permanent. Within days of the probes' launch on August 30, 2012, they showed a temporary third belt forming. It lasted about four weeks before a shock wave from the Sun wiped it out, and NASA announced the find on February 28, 2013.
The probes were built to dive through the belts up to six times a day, and the mission, planned for two years, ran almost seven. Probe B was switched off on July 19, 2019. Probe A re-entered the atmosphere over the eastern Pacific on March 11, 2026, NASA said, years ahead of a 2019 projection that had put its return in 2034. NASA blamed extra drag from intense space weather around solar maximum, the peak of the Sun's activity cycle, and it doesn't expect Probe B to come down before 2030.
Satellites in and around the belts, in our data
We took the 16,701 objects in our October 11 snapshot of CelesTrak's active list, the data behind our live satellite map. The list holds objects not known to be dead, mostly satellites plus a few rocket bodies. For each orbit we worked out the perigee and apogee, its lowest and highest points, measuring altitude above Earth's equatorial radius of 6,378 km, as CelesTrak does. By that measure, 15,886 of the 16,701 (95.12%) never climb above 2,000 km. Of the 815 that do, 583 keep their lowest and highest points between 34,000 and 37,500 km, in the geostationary belt, the ring about 35,786 km up where a satellite seems to hang still over the equator.
The band from 2,000 to 19,000 km is nearly empty. Only 49 satellites, 0.29% of the list, have a mean altitude (their average height over an orbit) in that range, and 33 of them belong to SES's O3b network. Thirty of those circle at 8,066 km (5,012 miles), the 20 first-generation satellites such as O3B FM2 plus ten of the newer mPOWER model. The other three are new mPOWERs still on stretched orbits. O3b's height falls inside the slot as the NASA release draws it, and we haven't seen SES say whether the slot played a part in choosing it.
Those three, mPOWER F11 to F13, first appeared in our September 27 snapshot on orbits that dipped to about 300 km and rose to about 6,660 km. By the October 8 snapshot their perigees had risen to between 583 and 678 km, with apogees near 6,770 km. On each 167-minute lap, more than eight a day, they climb from below the inner belt, past the 4,000 km electron peak in the JPL chapter, and back down.
Higher up, in medium orbit, our snapshot has 134 navigation satellites from the four systems compared in our GPS explainer, with 40 GPS, 33 BeiDou, 32 Galileo and 29 GLONASS. Their typical heights run from 19,130 km for GLONASS to 23,222 km for Galileo. Measured from the planet's centre in Earth radii, units of 6,378 km, they sit at 4.0 to 4.6. That puts them at the inner edge of the outer belt as the SVS draws it, below the electron peak the JPL chapter gives near 24,000 km. "The multi-billion-dollar Global Positioning System satellites skirt the edge of the safe zone," NASA Goddard's James Green said in the slot release.
Some orbits cut right through both belts. Fifteen satellites fly Molniya-type orbits, long ellipses tilted 62 to 66 degrees to the equator, with perigees of 719 to 3,190 km and apogees of 37,173 to 39,897 km. Fourteen of them, including ARKTIKA-M 1, take 11 hours 58 minutes per lap, so they climb up through both belts and back down twice a day.
For satellites, the main hazard from the belts is internal charging, which Horne and colleagues described in the journal Space Weather in 2013. High-energy electrons pass through a spacecraft's skin and build up charge on cables and ungrounded metal, which can then discharge and damage electronics. Designers answer with radiation-hardened parts, built to tolerate the exposure, and with aluminium shielding, though every bit of shielding adds launch mass. A 2025 worst-case study in the same journal used electron data from a GPS satellite. It found 2.8 mm of aluminium enough at geostationary orbit but about 4.5 mm needed at 4.5 Earth radii, between the GPS and Galileo orbits.
On July 9, 1962, a US high-altitude nuclear test called Starfish Prime created an artificial radiation belt that damaged several satellites. Telstar 1, launched the next day, was damaged by the new belt and later failed.
The South Atlantic Anomaly, the ISS and Hubble
At about 420 km, the ISS orbits below the inner belt, and so does Hubble at about 470 km. Both still cross the South Atlantic Anomaly, a region over South America and the South Atlantic where Earth's magnetic field is weakest and trapped particles reach down to their height. Field strength is measured in nanotesla (nT), and in NOAA's World Magnetic Model the weakest field at the surface today is about 22,000 nT, near 26°S, 61°W.
Hubble stops its science there. The Space Telescope Science Institute's guide for observers says the southern part of Hubble's orbit crosses the anomaly on seven to nine orbits in a row. Each time, observing halts for about 20 to 25 minutes, because background noise in the instruments and guidance sensors climbs too high. Hubble's live position shows when it's next over the region.
The anomaly has no sharp edge, so the time spent inside it depends on where you draw the line. We chose a surface field of 28,000 nT as our line. Then we ran both orbits forward three days from our snapshot, in 20-second steps, and added up the time when the ground directly below had a weaker field than that. By that measure the ISS is inside about 14% of the time, roughly 3.3 hours a day. A tighter line at 24,000 nT gives about 4%, and a looser one at 32,000 nT about 23%. Hubble comes out at about 15%, with a median crossing of about 19 minutes. That's a different measure from the institute's 20 to 25 minutes of halted observing, though of a similar size. The weak field at the ground is only a stand-in for the particles up at the spacecraft, so these are rough estimates, not radiation measurements. The ISS pass predictions show when the station next crosses your sky.
Can astronauts go through the Van Allen belts?
They can, and the Apollo crews did. NASA's Apollo Lunar Surface Journal lists the skin dose for each of the nine lunar missions, averaged across the crew. The figures are in rad, an older unit of absorbed radiation dose. They run from 0.16 rad on Apollo 8 to 1.14 rad on Apollo 14, with an average of 0.46 rad, and each covers a whole mission, belt crossings included.
NASA's Orion crew capsule took its own measurements on the uncrewed Artemis I flight in 2022. While it crossed the inner, proton-rich belt, dose rates in the cabin differed by a factor of four between the best- and worst-shielded spots, according to measurements published in 2024. Changing the capsule's orientation cut the dose rates during the crossing by about half.
The four Artemis II astronauts splashed down in the Pacific on April 10, 2026, after a lunar flyby. Before the flight, NASA Science reported that the cabin would carry six HERA radiation sensors and personal dosimeters for the crew. Set dose levels would trigger a caution, then a recommendation to shelter. We haven't found a post-flight dose report from NASA yet, and it's the number to watch.
Sources
- NASA Scientific Visualization Studio, Van Allen Probes Find Storage Ring in Earth's Outer Radiation Belt (belt altitudes) and Electron Beltway
- Barnes and Selva, NASA Jet Propulsion Laboratory, radiation effects chapter
- NASA, NASA Finds Lightning Clears Safe Zone in Earth's Radiation Belt (archived news release)
- NASA, NASA's Van Allen Probes Revolutionize View of Radiation Belts, 2015
- NASA, NASA's Van Allen Probes Reveal a New Radiation Belt Around Earth, February 28, 2013
- NASA, First of Two Van Allen Probes Spacecraft Ceases Operations, July 2019; Ten Highlights From NASA's Van Allen Probes Mission, October 2019; NASA's Van Allen Probe A Re-Entered Atmosphere, March 2026
- NASA, A Short History of Earth's Radiation Belts
- NASA Space Science Data Coordinated Archive, Telstar 1
- Horne et al., Space weather impacts on satellites and forecasting the Earth's electron radiation belts with SPACECAST, Space Weather, 2013
- Horne et al., Satellite Internal Charging for a Reasonable Worst-Case, Space Weather, 2025
- Space Telescope Science Institute, HST Primer: Orbital Constraints
- NOAA, World Magnetic Model (WMM2025, used for our anomaly estimate)
- NASA, Apollo Lunar Surface Journal, Working on the Moon: Radiation
- DLR and NASA scientists, Space radiation measurements during the Artemis I lunar mission, 2024; DLR, Orion spacecraft radiation protection tested, 2024
- NASA Science, To Protect Artemis II Astronauts, NASA Experts Keep Eyes on Sun; NASA, Artemis II Flight Day 10: re-entry live updates, April 10, 2026
- CelesTrak, active satellites element sets, snapshot of October 11, 2026, and our earlier snapshots from September 27 and October 8
Follow by RSS. Share this post: Bluesky · X · Reddit · Email
More from the blog
-
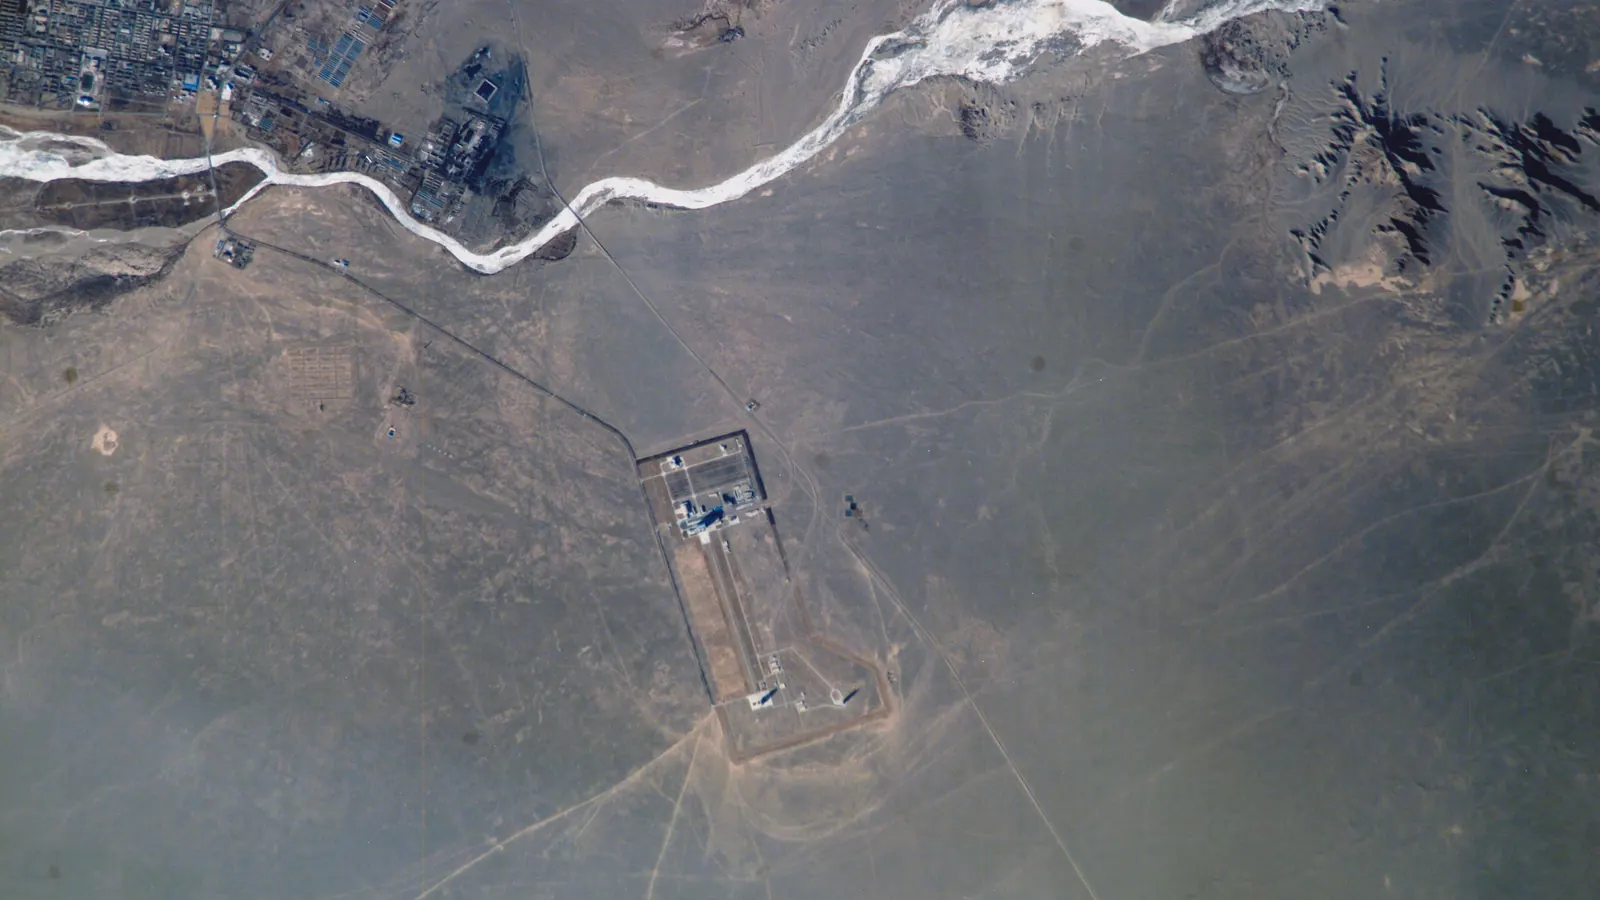
Where is China's Tiangong space station? Orbit and crew
China's Tiangong space station orbits about 386 km up on a 41.5° tilt, so it stays between 41.5° N and S. Who's aboard, its size, and where you can see it.
-
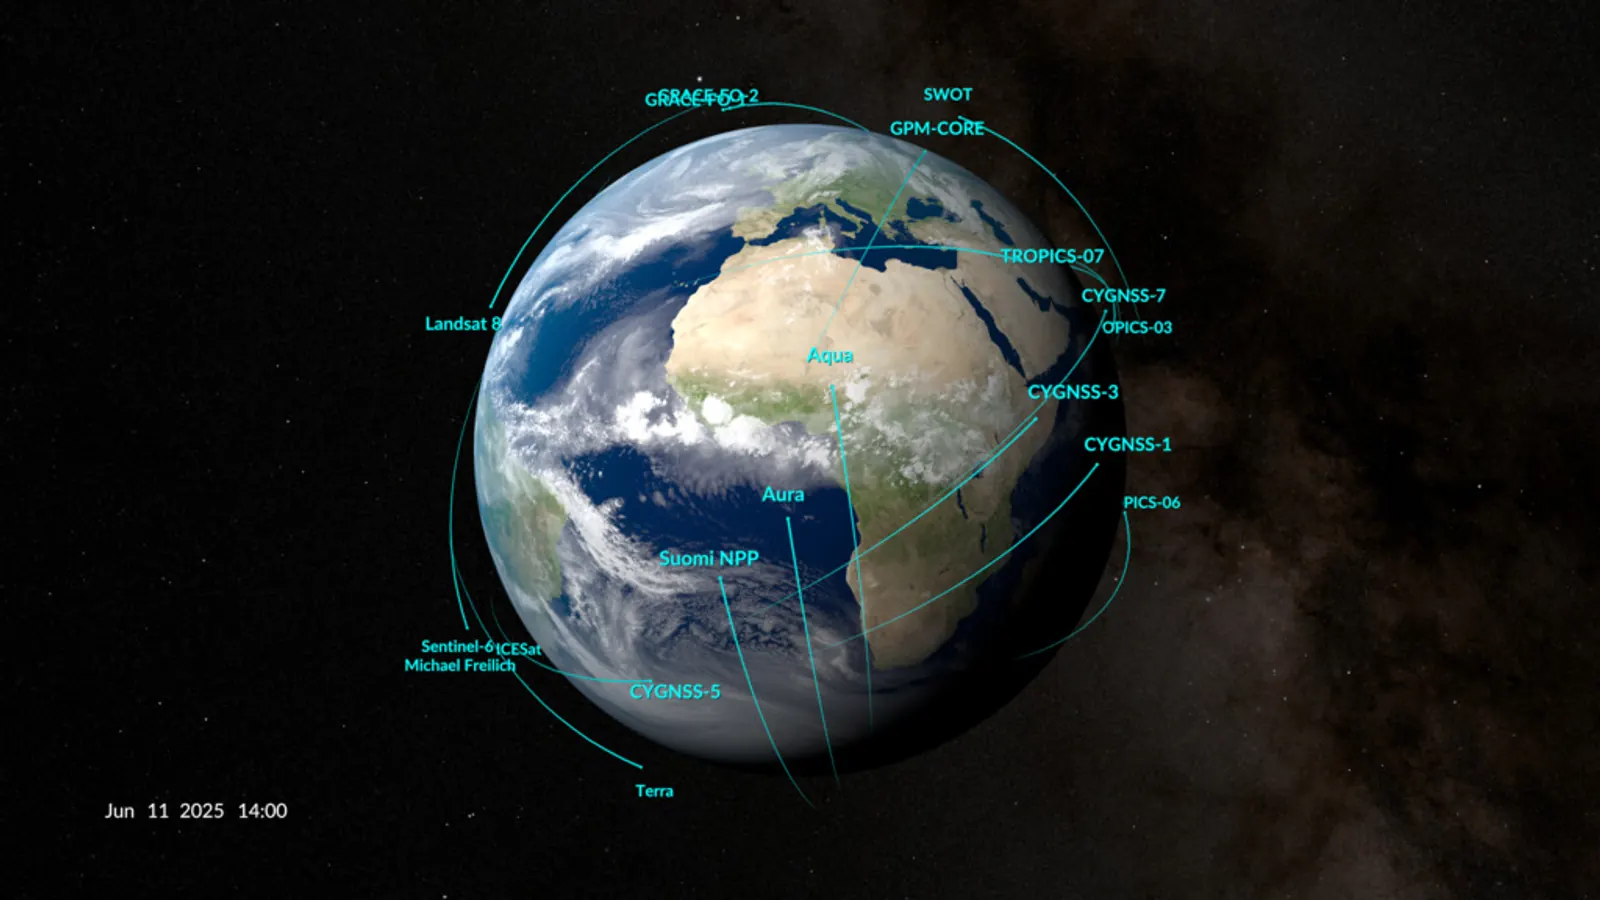
What are the types of orbits? LEO, MEO, GEO and HEO
The main types of orbits are LEO, MEO, GEO and HEO. Of 16,701 objects on CelesTrak's active list on October 11, 2026, 95 percent were in low Earth orbit.
-
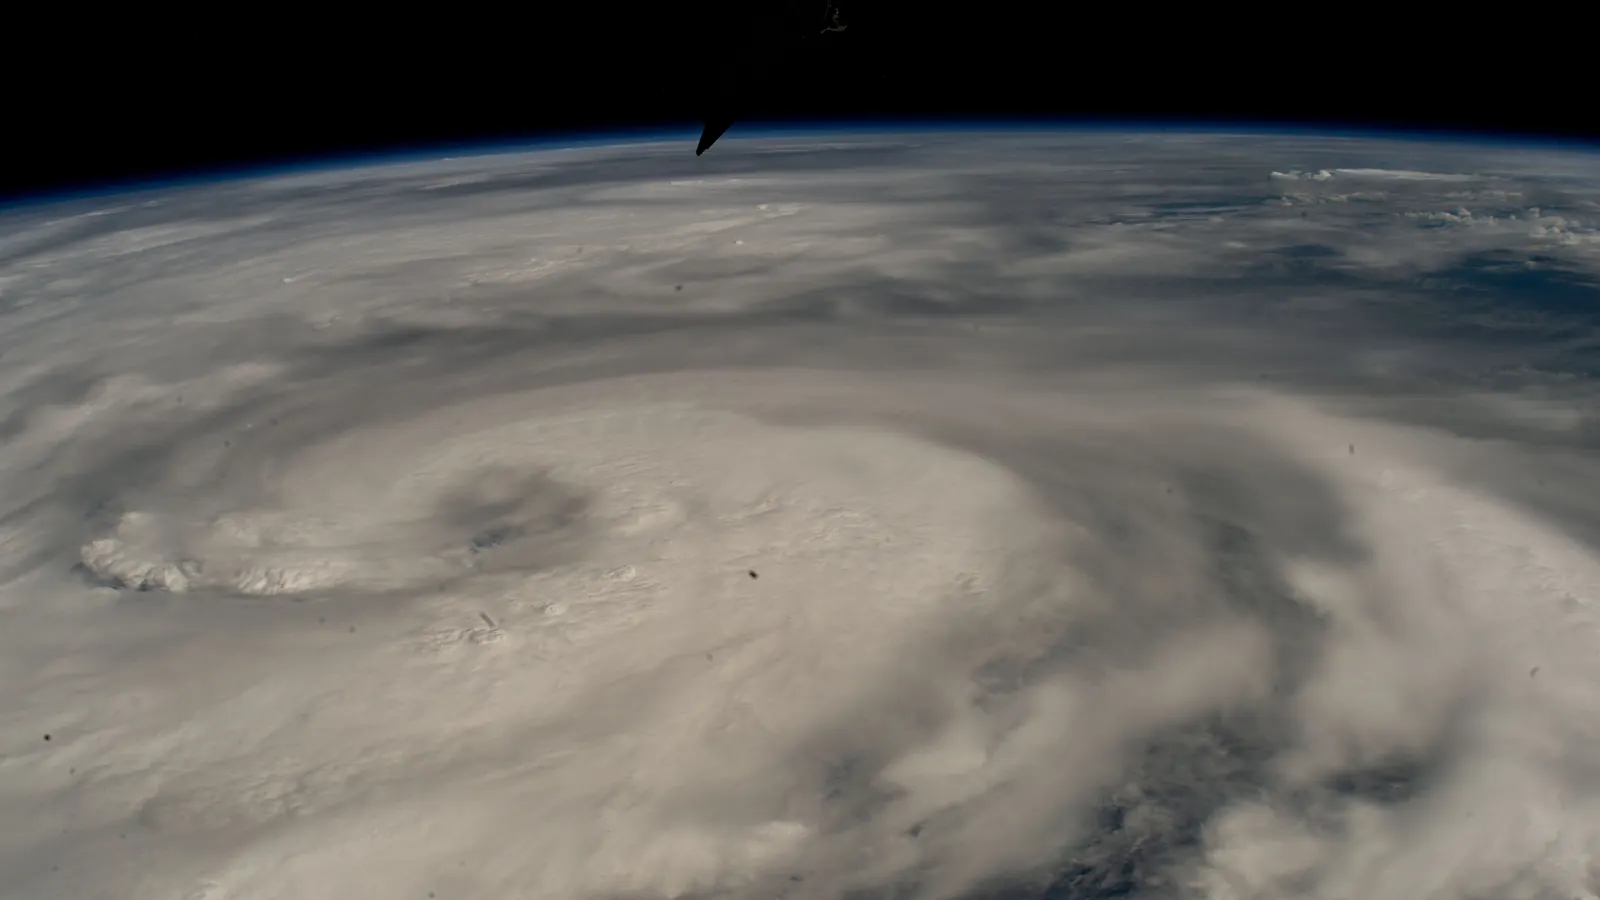
How do weather satellites work? Orbits, sensors and data
How weather satellites work: geostationary imagers 35,786 km up scan a full disc every 10 minutes, and low orbiters supply over 80% of forecast model data.
-
What is a geostationary orbit? Height, speed and delay
A geostationary orbit is a circle 35,786 km above the equator where a satellite keeps pace with Earth's spin and seems to hang still. We counted 573 there.
-
How many GPS satellites are there? Height and how GPS works
The U.S. Space Force counted 32 operational GPS satellites in April 2026, about 20,200 km up. How GPS works, and how Galileo, GLONASS and BeiDou compare.
Home · Live satellite map · Satellite directory · Starlink · OneWeb · Navigation satellites · Space stations · Other active satellites · Track the ISS · ISS visible passes · Starlink train · Rocket launches · Aurora forecast · Humans in space · Solar System · Deep Space · Embed widgets · Blog · Guide: spot the ISS · Guide: what is a TLE? · Guide: how many satellites? · Guide: satellite trackers compared · Discovery: Elias 2-24 b · About · FAQ · Data & methodology · Credits · Editorial policy · Accessibility · Contact · Privacy · Terms
© 2026 WatchSat · Not affiliated with any space agency or satellite operator.